
A retirement-ready investment property ROI calculator must deliver four things: net rental yield, return on equity (ROE), total ROI with annualized CAGR, and scenario outputs across bear, base, and bull conditions. Without all four, you're flying blind when modeling how a property fits your retirement plan.
Here's the short version of how to use those outputs:
- Net rental yield tells you the real income rate after costs, not the headline number agents quote.
- ROE shows how leverage changes your actual return on the cash you invested.
- Total ROI / CAGR lets you compare property against Super or ETFs on equal footing.
- Scenario outputs reveal whether your retirement plan survives a rate shock or a flat market.
Convert the after-tax annual cashflow into a projected retirement income stream. If the property generates a positive after-tax cashflow in your base scenario, that's correspondingly less you need to draw from Super. Run the bear scenario to see how much that number shrinks under stress.
Pro Tip: Aerowealth models Super, investment property, mortgages, and ETFs side-by-side with scenario comparisons, so you don't have to reconcile four separate spreadsheets. Its retirement modelling platform reports planning success rates of up to 94%.
Table of Contents
- What does an investment property ROI calculator actually measure?
- What inputs do you need for an accurate ROI estimate?
- How do you run the calculator and translate outputs into retirement numbers?
- How do you build scenarios and stress tests that protect your retirement plan?
- What Australian tax points materially change your ROI calculation?
- What do basic calculators miss, and what mistakes overstate returns?
- How do you plug property ROI outputs into a full retirement model?
- Aerowealth gives you scenario-based property ROI inside a full retirement model
- Key Takeaways
- The property ROI number that actually matters for retirement
- Sources and further reading
- FAQ
What does an investment property ROI calculator actually measure?
Most people think gross rental yield is the number that matters. It isn't. Gross yield is a quick income check — annual rent divided by purchase price — and it ignores every cost that makes or breaks a real investment.
A calculator worth using for retirement planning produces all of these:
- Gross rental yield: Annual rent ÷ purchase price. Useful only as a first filter.
- Net rental yield: Annual rent minus all non-mortgage operating costs, divided by purchase price. This is the real income rate.
- Cash-on-cash return: After-debt-service cashflow divided by cash invested. Tells you how hard your deposit is working each year.
- Return on equity (ROE): Net annual return divided by your current equity stake. Because of leverage, ROE is often far larger than the asset return — but it also amplifies downside risk.
- Total ROI: (Capital gain + cumulative net rental income − selling costs) ÷ total cash invested.
- CAGR: The annualized version of total ROI. This is the number you need to compare property against a Super fund returning 7% per year or an ETF portfolio.
- Pre-tax and after-tax cashflow: Separate figures, not blended. A property can run at a taxable loss while still costing you real money each week.
- Projected sale proceeds: Estimated net amount after agent commissions, conveyancing, and CGT.
ROE deserves extra attention for retirement planners. If you put $150,000 into a $750,000 property and it grows 5% annually, the asset return is 5% — but your ROE on that $150,000 deposit is much higher because the entire $750,000 is appreciating. That's the leverage effect. It works in reverse too, which is exactly why stress-testing matters.
Pro Tip: Spot-check one output manually. Net rental yield = (Annual rent − annual operating costs) ÷ purchase price × 100. If the calculator's figure doesn't match yours within a rounding margin, its logic may be off.
What inputs do you need for an accurate ROI estimate?
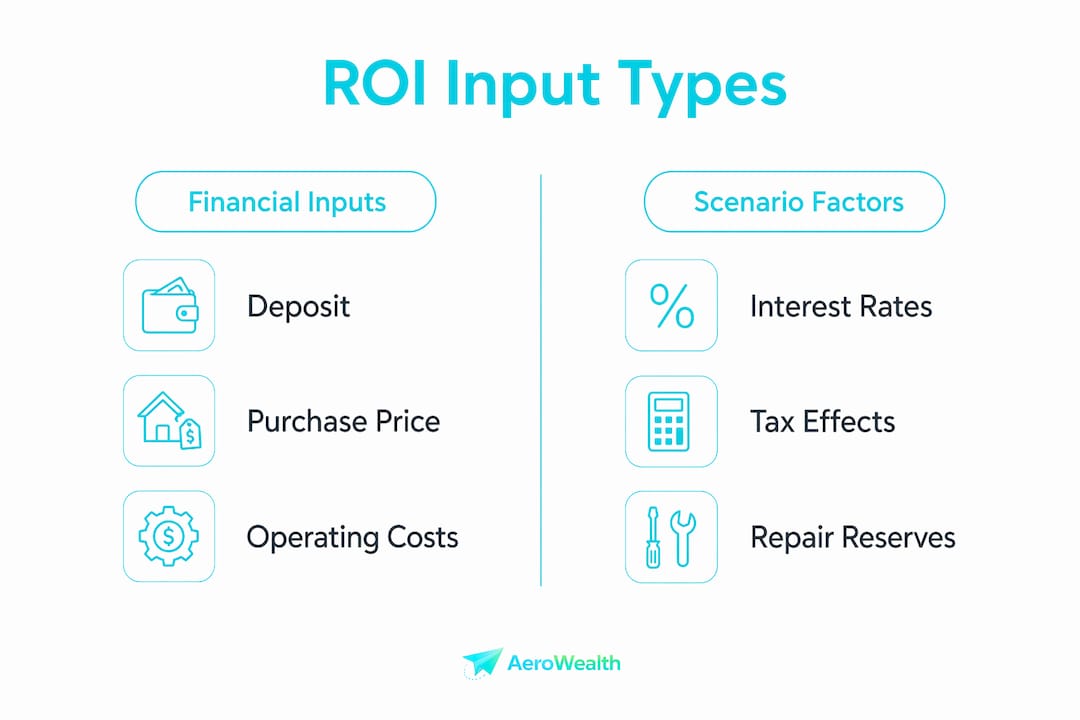
Garbage in, garbage out. Before you touch a calculator, collect these:
| Input Category | Specific Items |
|---|---|
| Purchase costs | Purchase price, deposit, stamp duty, legal fees, building inspection, borrowing costs |
| Loan details | Loan balance, interest rate, loan term, P&I vs interest-only structure |
| Rental income | Weekly rent, vacancy allowance (typically 2–4 weeks per year) |
| Operating costs | Council rates, water rates, strata/body corporate fees, landlord insurance, property management fees (typically 7–10% of rent), repairs and maintenance allowance |
| Tax inputs | Marginal tax rate, Medicare levy, depreciation estimate (Div 40 plant and equipment, Div 43 capital works) |
| Growth assumptions | Expected annual capital growth rate, expected annual rent growth rate |
| Holding period | Years you plan to hold before sale or retirement drawdown |
| Exit assumptions | Agent commission ( |
Beyond the table above, a few optional inputs make a real difference:
- Special strata levies or sinking fund contributions
- Major capital repair allowance (roof, plumbing, electrical)
- Offset account balance and its effect on interest charges
- Land tax (varies by state and total portfolio value)
Pro Tip: Pad your ongoing operating costs by 5–10% above your best estimate. Special levies and major repairs arrive without warning and can force early asset disposal if you haven't provisioned for them.
How do you run the calculator and translate outputs into retirement numbers?
Follow this sequence to get results you can actually use:
- Enter all inputs from the checklist above. Use conservative rent and growth assumptions for your base case.
- Run the base scenario and record: net rental yield, ROE, total ROI, CAGR, and the year-by-year cashflow and equity schedule.
- Run the bear scenario using preset assumptions such as 2% growth and 7.5% interest. Note how after-tax cashflow changes and how many extra years you'd need to work.
- Run the bull scenario (e.g., 8% growth, 5.5% interest) to set an upside ceiling — not a plan.
- Convert after-tax annual cashflow into a retirement income figure. If the base scenario produces a positive after-tax cashflow, that's a direct offset against your Super drawdown requirement.
- Use CAGR to compare. If your property CAGR and your Super fund target are close, the gap may be small — but the property carries liquidity risk and management overhead that Super doesn't.
A quick worked example: you buy a $700,000 property with a $140,000 deposit plus $30,000 in acquisition costs ($170,000 total cash in). After 10 years at a modest capital growth rate, the property value increases significantly, and net rental income over 10 years adds to returns. Selling costs and CGT reduce proceeds notably. Total return calculation combines capital gain, net income, and exit costs relative to invested cash, resulting in a substantial total ROI and annualized CAGR. That's the number you carry into your retirement model.
Watch for the pre-tax vs. after-tax split. Year-by-year projections that separate taxable profit from actual cashflow show you whether negative gearing is masking a real cash drain. A property losing $10,000 per year on paper might only cost you $6,500 out of pocket after the tax offset — but you still need that $6,500 in liquid funds every year until retirement.

Pro Tip: For retirement income strategies, always record two cashflow figures: what hits your bank account and what appears on your tax return. They're often very different numbers.
How do you build scenarios and stress tests that protect your retirement plan?
Bear/base/bull is the minimum. Professional modelers treat it as a starting point, not a finish line.
- Capital growth shock: Test 0% growth for five years. Does the property still make sense, or does it become a drag on your retirement timeline?
- Interest rate shock: Add 200–400 basis points to your current rate. At +300 bps, what happens to monthly cashflow? Can you cover the shortfall without selling?
- Vacancy shock: Model 8–10 weeks of vacancy in a single year. How does that hit annual cashflow?
- Rent growth stagnation: Assume rent stays flat for three years. Does the yield still justify the capital tied up?
- Maintenance spike: Add a $20,000 unplanned repair in year 5. Does your liquidity buffer absorb it?
The outputs to watch during stress tests aren't just dollar figures. Track how many extra years you'd need to work under each scenario, whether equity turns negative under a severe growth + rate shock, and whether cashflow shortfalls exceed your buffer capacity.
Scenario functionality and cross-asset comparison are what separate a retirement-grade tool from a basic yield calculator. Seeing that a +300 bps rate shock pushes your retirement date back two years is the kind of insight that changes a decision.
Pro Tip: Use the interest-rate stress test to find your break-even rate — the rate at which the property becomes cashflow negative beyond your buffer. If that rate is only 1% above current levels, your retirement plan carries more interest-rate risk than it probably should.
What Australian tax points materially change your ROI calculation?
Keep this high-level. The specifics depend on your marginal rate, ownership structure, and timing — consult a registered tax agent before acting.
- Negative gearing: When deductible expenses (interest, rates, management fees, depreciation) exceed rental income, the net loss reduces your taxable income. The tax saving is real money, but it doesn't eliminate the cash outflow. For detailed deduction guidance, the ATO's published rates apply for 2025–26.
- Depreciation: Div 40 (plant and equipment) and Div 43 (capital works) create non-cash deductions that improve after-tax cashflow without affecting your bank balance. Use a quantity surveyor's estimate, not a guess.
- CGT: The 50% CGT discount applies to individuals who hold the property for more than 12 months. Selling costs — agent commissions of roughly 2–3% and conveyancing of approximately $2,000 — reduce your cost base, which affects the taxable gain.
- Medicare levy: Your effective marginal rate includes the 2% Medicare levy. A calculator that applies only the income tax rate understates your tax liability.
Always confirm whether a calculator's outputs are pre-tax or after-tax. Many online tools present pre-tax ROI and require you to layer in CGT and negative gearing separately.
Pro Tip: For CGT timing in retirement, selling in a year when your taxable income is lower — for example, after you've stopped working — can materially reduce the CGT bill. Model that timing explicitly.
What do basic calculators miss, and what mistakes overstate returns?
The most common errors aren't math errors. They're omission errors.
- Gross yield as the headline metric. A 5% gross yield on a $900,000 property sounds solid until you subtract management fees, rates, insurance, strata, and vacancy. Net rental yield is typically significantly lower.
- Ignoring selling costs and CGT. Agent commissions and CGT can consume $60,000–$100,000 on a mid-range property sale. Omitting them inflates total ROI significantly.
- Interest-only confusion. An interest-only loan improves short-term cashflow but doesn't reduce the debt. Comparing a P&I and an interest-only scenario as if they're equivalent is a structural error.
- Single-point growth assumptions. Modeling only 6% annual growth with no downside case is optimistic planning, not retirement planning.
- Omitting special levies. A $15,000 special levy in year 3 can wipe out two years of positive cashflow. If it's not in the model, the model is wrong.
Pro Tip: Always separate pre-tax cashflow from taxable profit/loss. A property that looks like a $12,000 annual loss on your tax return might only cost $7,500 out of pocket — but you need to know which number to use when deciding whether the property supports your retirement income.
How do you plug property ROI outputs into a full retirement model?
The property doesn't exist in isolation. It sits alongside Super, ETFs, and other income sources — and the interaction between them is where retirement planning gets complicated.
| Output to Export | Where It Goes in the Retirement Model |
|---|---|
| After-tax annual cashflow | Annual income stream during accumulation and early retirement |
| Year-by-year equity schedule | Net worth projection and borrowing capacity timeline |
| Expected sale proceeds (post-CGT) | Lump-sum capital event in the retirement income model |
| CAGR | Cross-asset comparison against Super and ETF return assumptions |
Here's a practical example. Suppose your property model shows $12,000 per year after-tax cashflow in the base scenario and projected sale proceeds of $380,000 in year 15 (post-CGT). Your Super is projected to reach $620,000 by the same date. Combined, you're looking at a significant capital sum plus an income stream from the property during the accumulation phase. Now run the bear scenario: cashflow drops considerably and sale proceeds fall substantially. Retirement age may shift notably. That's the number that matters.
For comparing property with Super and ETFs, use CAGR as the common currency. A property CAGR of 7% and a Super fund CAGR of 7.5% look similar, but the property carries liquidity risk, management costs, and concentration risk that don't show up in the CAGR figure alone.
Integrated tools that model property, Super, and mortgages together reduce the reconciliation errors that come from running separate calculators and manually combining outputs. When tax timing, bridge years before Super preservation age, and cashflow sequencing all interact, a single connected model gives cleaner answers than three spreadsheets stitched together.
Pro Tip: For investment property forecasting across a 15–20 year horizon, update your assumptions at least annually. Growth rates, interest rates, and your own marginal tax rate all shift — a model built on 2024 assumptions may be materially wrong by 2028.
Aerowealth gives you scenario-based property ROI inside a full retirement model
Aerowealth is built specifically for Australians who need more than a standalone yield calculator. It models investment property alongside Super, ETFs, and mortgages in one connected plan, so you can see how a property decision affects your retirement age and expected annual income without reconciling separate tools.

Key features for retirement planners:
- Side-by-side scenario comparisons (bear/base/bull) across property and Super simultaneously
- Tax-aware projections that apply your marginal rate, Medicare levy, and CGT timing
- Bridge-year modeling for early retirement before Super preservation age
- Year-by-year equity and cashflow tables you can export for an adviser
- CGT-aware sale modeling that shows net proceeds in the year you plan to sell
- AI assistant that explains projections under Australian rules
Aerowealth offers a free plan for getting started and a paid Pro subscription for expanded scenario volume, advanced mortgage features, and higher AI assistant usage. If you're serious about modeling your retirement with property as a core asset, start with the free plan and upgrade when you need more scenario depth.
Key Takeaways
A retirement-ready property ROI calculation requires net rental yield, ROE, total ROI with CAGR, and scenario outputs — all converted into retirement income projections, not left as raw percentages.
| Point | Details |
|---|---|
| Net yield over gross yield | Gross yield ignores costs; net rental yield is the real income rate for retirement modeling. |
| ROE reveals leverage impact | Return on equity shows how your deposit is actually performing, not just the asset. |
| CAGR enables cross-asset comparison | Annualized total ROI lets you compare property directly against Super or ETF return assumptions. |
| Stress-test with +200–400 bps rate shock | An interest-rate shock reveals whether your retirement timeline is resilient or fragile. |
| Aerowealth integrates all assets | Aerowealth models property, Super, and mortgages side-by-side for integrated retirement projections. |
The property ROI number that actually matters for retirement
Most retirement planners focus on the wrong output. They run a calculator, see a 7% total ROI, and feel confident. The number that actually determines whether a property helps your retirement is the after-tax annual cashflow in the bear scenario — because that's the income you can count on when markets don't cooperate.
Chasing headline ROI figures from bull-case assumptions is how people arrive at retirement with a property that looks great on paper and costs them $800 per month out of pocket. The bear scenario isn't pessimism. It's the scenario you need to be able to afford.
Leverage is the other underappreciated variable. ROE can look extraordinary when growth assumptions are generous, but the same leverage that amplifies gains will amplify losses if values stagnate or fall. Retirement planning with property means being honest about what happens when both growth and rates move against you simultaneously — not just one of them.
The best use of a property ROI calculator isn't to confirm a decision you've already made. It's to find the conditions under which the decision breaks, and then decide whether you can live with those conditions.
Sources and further reading
These resources cover the calculation methodology, tax guidance, and scenario frameworks referenced throughout this article:
- Investment Property Calculator — ROI, Tax & Cash Flow — combines negative gearing, rental yield, land tax, and CGT in one tool using 2025–26 ATO rates.
- Investment Property Calculator Australia Guide for 2026 — PropBoss — practical guide covering loan structure, expenses, and total return modeling.
- ROI Calculator Australia — PropertyGo — free tool for gross yield, net yield, cashflow, and 10-year total return estimates.
- How to calculate investment property return — Nestegg — step-by-step ROI formula walkthrough for Australian investors.
- Tax Write-Off Investment Property: Your 2026 Australian Guide — Aerowealth Blog — detailed deduction and depreciation guidance.
- Retirement Income Strategies for Australians: 2026 Guide — Aerowealth Blog — how to translate property ROI into retirement income planning.
- Aerowealth — Integrated Retirement Modelling Platform — model Super, property, ETFs, and mortgages side-by-side with scenario comparisons and tax-aware projections.
This article is general information only, not personal financial or tax advice. Confirm your specific situation with a registered tax agent, accountant, or licensed financial adviser before making investment or retirement decisions.
FAQ
What should an investment property ROI calculator include?
A reliable calculator must cover net rental yield, return on equity, total ROI with CAGR, after-tax cashflow, and scenario outputs across at least three growth and interest-rate assumptions. Calculators that show only gross yield or pre-tax figures are insufficient for retirement planning.
How do you convert property ROI into a retirement income figure?
Take the after-tax annual cashflow from your base scenario and treat it as a direct income offset against your Super drawdown requirement. Then run the bear scenario to see how much that income shrinks under adverse conditions — that's the number to plan around.
What is the CGT discount for Australian investment properties?
Individuals who hold an investment property for more than 12 months qualify for a 50% CGT discount on the capital gain. Selling costs including agent commissions of roughly 2–3% and conveyancing of approximately $2,000 also reduce the taxable gain.
Why does return on equity matter more than asset return for leveraged property?
Because you invest a deposit, not the full purchase price. ROE measures your return on the cash you actually put in, which is amplified by leverage. A 5% asset return can translate to a much higher ROE on a 20% deposit — but the same leverage increases your exposure to downside scenarios.
Can Aerowealth model investment property alongside Super and ETFs?
Yes. Aerowealth models investment property, Super, mortgages, and ETFs in one connected plan, with side-by-side scenario comparisons, CGT-aware sale modeling, and bridge-year projections for early retirement before the Super preservation age.